Everyone wants to know when and where Bitcoin will bottom out, but, in fact, no one exactly knows it. The simple answer is that if anyone knew when Bitcoin would bottom, no one had purchased it before that.
For instance, Microstrategy purchased 152,800 Bitcoin at an average price of $29,672. If they knew the bottom, they must not have added expensive Bitcoins to their balance sheet. Isn’t it so?
There are many other examples in Bitcoin history; where corporations, investors, and analysts made very wrong decisions about Bitcoin.
So I understand that any prediction can get wrong, but there is one clue that can help anyone find Bitcoin’s local bottom; We can at least guess where Bitcoin could bottom out.
Let’s get started. To understand the hack, you should first understand two important things about crypto.
On this page
Crypto makes complex mathematical patterns.
If you closely analyze the crypto market, you will sooner realize that it’s following some patterns on the macro level with a lot of volatility.
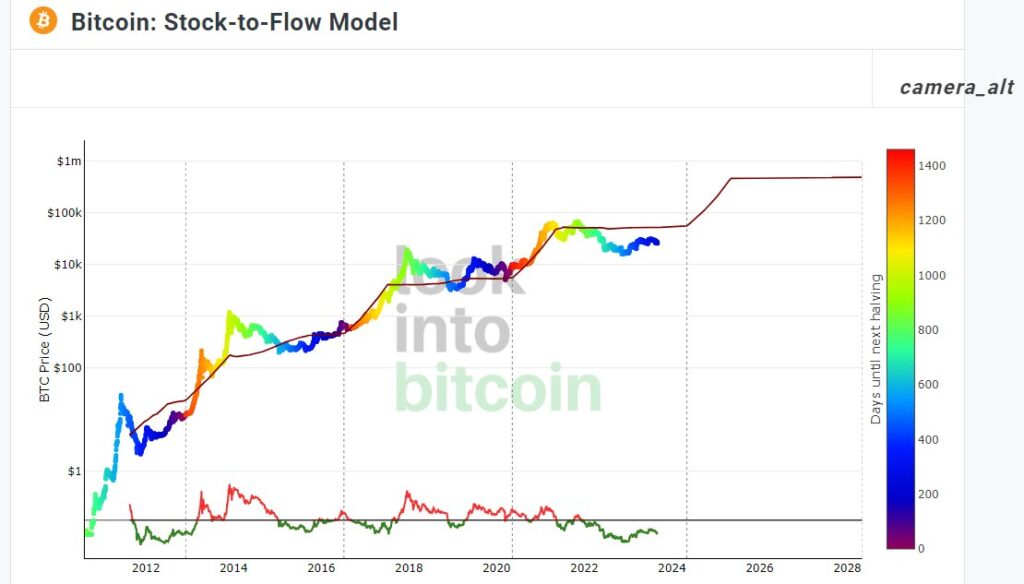
For instance, PlanB has tried to trace that pattern of Bitcoin on a macro level. If you look at his Bitcoin stock-to-flow model, it seems realistic to expect Bitcoin price according to PlanB’s Bitcoin S2F model.

Although, PlanB’s Bitcoin prediction didn’t come true in 2021 and 2022. He used to claim that China’s crypto ban and other factors influenced Bitcoin price. And he is still optimistic about his chart.
Whether his price predictions come true or not, if we monitor the movement of Bitcoin price on the chart, it’s not hard to guess that Bitcoin has been following a pattern on the very macro level for years. After 2012, It’s moving around a trend line drawn at 45 degrees.
We can now dig deep into the pattern and guess the Bitcoin bottom price. To do that, first, you should understand the following crypto rule.
Crypto price moves on both sides.
If you are in day trading, you might already know that crypto price also moves on both sides. But the movement is pretty different from the Gold movement.
If any coin’s price goes up, it will definitely come down; we call it retest or confirmation in trading.
Day traders use this volatility to make profits on each level.
Now traders and investors are so sure about retests that none of the experts suggest entering the market without confirmation of the breakout.
Day traders draw trendlines, use support and resistance, and candle stick patterns to guess retest points. All such techniques are golden rules for day traders.
Let’s move forward to our simple hack without getting into the details of all the golden rules.
If any coin has not retested any price at any time frame but started moving forward, it will surely come back to retest that price again on that time frame.
Now let’s elaborate on it.
Restest are done on each time frame.
If you are a beginner, you might not know that traders trade on each time frame: 1m, 5m, 15m, 1h, 4h, 1 day, 1 week, etc.
You will notice that candles follow the same golden rules in each time frame.
For instance, we had already discussed that it’s not wise to invest in a coin if it has not retested its local bottom on a monthly time frame.
Makes sense?
Here is the thumb rule.
If any coin (Say Bitcoin) doesn’t restest for breakout confirmation, it will surely return to that level again.
That’s the simple hack we can use to find the Bitcoin bottom. Let’s use this simple hack to see which price Bitcoin is more likely to bottom.
Bitcoin bottom prediction with the hack mentioned above.
Look at the Bitcoin to USD chart for the monthly time frame.

Before the bull run started in 2020, bitcoin followed a very nice pattern. Its movement was on both sides, and it was a perfect movement.
But suddenly, at $12,000, bitcoin started jumping higher and higher. It was the beginning of the bull run.
It didn’t retest that support level (point mentioned in the image), so the confirmation is due. If this happens at any price, the price will surely return to that price after some specific period.
I also mentioned in the image that when Bitcoin broke the trend without confirmation in 2019 (on the monthly chart), it returned and retested that point in 2020 (after a few months) – it was bitcoin bottom in 2020.
In the above scenario, we can say that Bitcoin’s bottom will be somewhere around $12000 to end this bearish period and start the next bull run.
Now let’s see when this can happen.
If we consider this jump of January as a fake out, there is a bull flag, which might touch the bottom line in March-April 2023.
So we can say that the Bitcoin bottom will be at around $12,000 in March-April.
Why may the prediction not come true?
As PlanB has mentioned that many external factors influence forex, stocks, and crypto industries.
So we might see some unusual influencers push the Bitcoin price higher or lower. Otherwise, it’s likely to happen in the following months.
You can use the above-mentioned hack to find the bottom of any coin, but there are cases when the hack may not work.
- It’s a new coin.
- Something is wrong with the circulating supply of the coin. It’s increasing or decreasing. As happened with Luna and MoonRabbit.
- The coin adopted new technology or something big like that. (In that case, the coin will come closer but may not touch the actual point).
So, anyone, even a beginner, can use the same technique to find the bottom of any coin. The same hack is applicable at any time frame to find the local bottom as well.
